

Sandbox vs Decentraland : the leading 'metaverses'

The proposition of a metaverse is one that comes up several times through the fantastical tales spun by science fiction novelists. The first mention of the term was in Neal Stephenson’s novel, Snow Crash. However, we have never been as close to a fully materialised metaverse as we are at the moment. Over the past couple of years, blockchain services such as the Sandbox and Decentraland have drawn attention to the endless possibilities the metaverse presents. The amount of attention and resources that are being funnelled into this proposition presents a unique opportunity for those who believe in these projects to get in at the ground level. In this article, I will attempt to provide a brief understanding of the fundamentals of the Sandbox and Decentraland, such as tokenomics and network strength, which are currently the largest metaverse projects the blockchain world has to offer.
The Sandbox
The Sandbox was initially a mobile-based community sandbox platform that allowed users to develop their own unique experiences and share them within the community. This game was released in 2012, and since then, there have been over 70 million unique experiences created by the users that motivated over 40 million downloads of the game. In 2018, the brand was acquired by Animoca Brands. Animoca Brands is one of the largest names in the blockchain gaming industry. Predictably, Animoca Brands used their newly acquired branding for the Sandbox to develop a 3D open world game based on the Ethereum blockchain. This game draws from the open-ended nature of its predecessor and allows users to develop their own experiences.
The experiences built in the Sandbox are reliant on the LAND system. Within the Sandbox metaverse, users can purchase plots of LAND that they may use to create unique experiences that allow them to monetise their creations. These experiences are built by content creators who design in-game assets that can be deployed as NFTs within the LAND that they own, or just on the Sandbox marketplace for other users to buy in exchange for SAND, which is the native utility token of the Sandbox. The LAND tokens are also traded as NFTs, which adds another dimension of monetisability and liquidity to what is essentially virtual real estate. There are three kinds of LANDs within the Sandbox metaverse. The first is a basic LAND, which is the fundamental real estate token upon which all other forms are based. This is a 96 x 96 metre square within the metaverse. The second kind is an Estate, which is a combination of multiple LANDs. The third and final kind is a LAND District, which is essentially an Estate, but is owned by multiple players. All of these can be purchased and developed into unique experiences for the sake of monetisation. It is precisely this possibility that has likely motivated stalwarts in the gaming industry like Atari to purchase plots of LAND within the Sandbox metaverse.
The basis of the utility within the Sandbox metaverse is the SAND token. This token serves as a medium of exchange between players and content creators to trade in-game assets and LAND, or for rental payments to access a curated experience. SAND is also used by creators to upload their creations as in-game assets. Sandbox also allows SAND holders to participate in governance of the metaverse and aims to move to a full-fledged DAO model by 2023. Finally, SAND tokens can be staked on the network for rewards. Indicators regarding the way users interact with the SAND token can be useful to understand the health of the Sandbox ecosystem. Hence, the rest of this section will use various metrics to attempt to understand how users interact with the ecosystem.
The SAND token has a max supply of 3 billion tokens, of which roughly 31%, or 919,498,319 tokens are currently in circulation. The infographic below indicates the token release schedule for the rest of the SAND tokens, and therefore indicates when the circulating supply will increase.

This vesting schedule and the tokenomics indicate a fundamentally strong token. The infographic below shows the ownership statistics of SAND, whales for the sake of this infographic have been defined as wallets holding more than 1% of the circulating supply, and an investor is defined as a wallet holding anywhere between 0.1% to 1% of the circulating supply. The whales control 84.05% of the total supply of SAND, while investors control 9.64%, with retail investors picking up the remaining 6.32%.

The strength of the network can be understood through the value transferred through it. This can be analysed by looking at the number of transactions on the network, and their total value. The infographics below show these values superimposed upon the token’s price action.
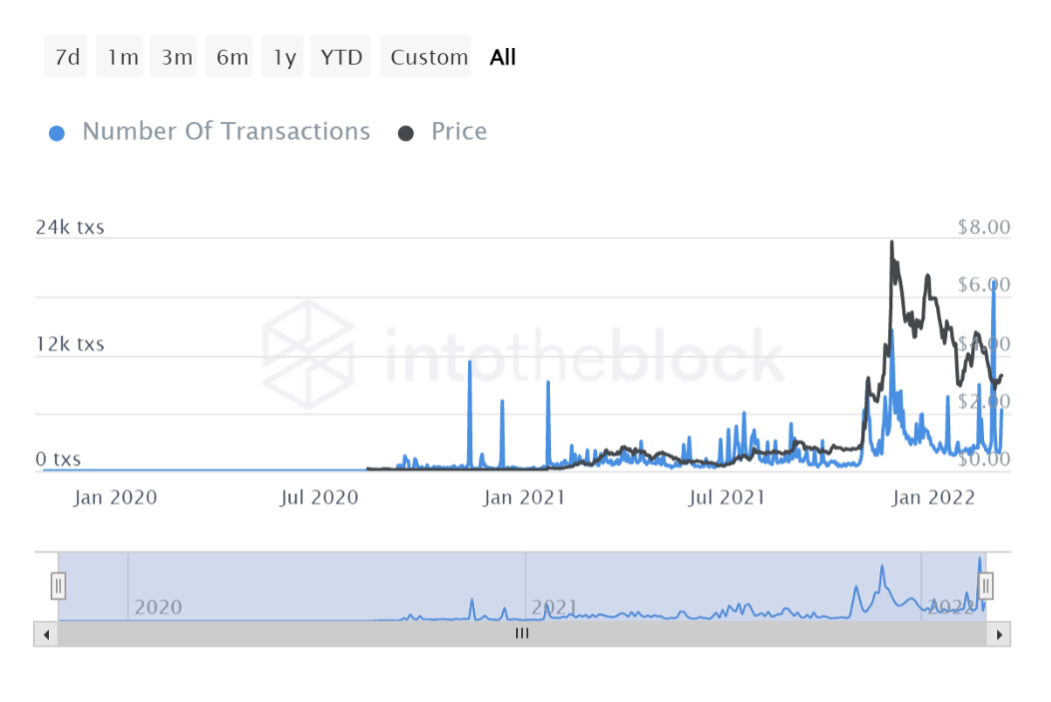
The 7-day average for transaction volume in the above infographic is $126.41 million, with a 7-day low of $80.98 million, and a 7-day high of $194.63 million. The same metrics for the number of transactions a day are about 3000 transactions on average, with a low of 1880, and a high of 6320. However, it is difficult to draw a correlation between these indicators and the price action of the token, the best use of this information is to understand the health of the network and the faith the users put into it to gauge the value of the network in the long-term. Some more useful information about the activity on the network can be taken from the time taken between transactions. The 30-day average for the average time between transactions is 46 seconds, with a high of 1 minute and a low of 20 seconds. The average size of these transactions is also useful, and it has a 30-day average of $48,764.19, with a low of $21,279.88, and a high of $103,747.12. These indicators show a healthy, and active network which users entrust with exchanging value over. The value being swapped hands over the network is also substantial and indicates that the network is being entrusted with assets that multiple users consider to be extremely valuable. All of this points to an understanding that the Sandbox metaverse is home to a strong network of users who place a premium on some of the digital assets that populate it.
Despite all these indicators, the glaring fundamental issue with the Sandbox is that the game has not been fully released to users yet. It is currently in the public alpha stage, with the roadmap indicating that Q1 2022 is when the metaverse will slowly be opened to LAND owners, and progressively allowing more users into the metaverse over the rest of the year. This compounds with all the attention the game has garnered over this year to produce an even worse problem, eventually launching the game will be daunting for the developers and content creators. There has been a long history of video games in development stages receiving endless attention, and this leading the developers to launch a game that isn’t finished yet (read Cyberpunk 2077). Lastly, even though the Sandbox uses the Ethereum blockchain, and plans a launch of a Layer-2 dual chain solution on Polygon in Q4 2021, the entire game is hosted on a single AWS server. This carries the concerns of having a single point of failure, and brings in to doubt the decentralised nature of the platform.
Decentraland
Decentraland is a VR-based decentralised platform that is also based on the Ethereum blockchain. The Decentraland platform has units of space like LAND in the Sandbox that are split into parcels. These parcels can be purchased as NFTs using the native token of the Decentraland network, MANA. The basic functionalities of the Decentraland metaverse are like the Sandbox. Parcels can be purchased by content creators to develop experiences within the metaverse. Content creators can also create in-game assets and deploy them as NFTs in the metaverse, which users can purchase using MANA. The fundamental difference between the Sandbox and Decentraland is that the Decentraland metaverse is a VR-platform, whereas the Sandbox is not. Another key difference is that the number of LAND units is not limited like the Sandbox. In Decentraland, when LAND units are first added to the registry, they are done so by burning MANA. Lastly, unlike the Sandbox, the platform itself is not hosted on a centralised server but is hosted over the decentralised network. Decentraland is also ahead in its roadmap as compared to the Sandbox, with the platform already being fully released in 2020 and its establishment as a DAO. Through the DAO, users may vote for certain projects to be funded through MANA that the DAO earns to keep is sufficiently independent. Like the analysis of the Sandbox, this article will analyse the strength of Decentraland through analysis of its native token, MANA.
The MANA token has a maximum supply of 2,193,917,527 of which around 60% or 1,327,372,145 tokens are in circulation. The token itself is deflationary as it is burned to add LAND to the registry. Until early 2020, 2.5% of every transaction’s value was burned in MANA as well. However, the DAO decided to discontinue this practice. The infographic below indicates the spread of the token over whale, investor and retail wallets.

The whales control 51.79% of the total supply of the MANA token, the investors control 28.97%, and the retail wallets control 19.23%. This spread is more attractive than that of the Sandbox as the tokens are more evenly distributed across wallets. Along with this spread, the consistent burning of MANA indicates that the tokenomics of the MANA token is more robust than that of the Sandbox. To fully understand this comparison, we must shift our focus to analysis of the network. Similar metrics are used for comparison to the Sandbox. The infographics below indicate the number of transactions, and their total value superimposed over the token’s price.

The 7-day average for transaction volume is $110.3 million, with a 7-day high of $193.09 million, and a low of $51.39 million. The Decentraland network processes a 7-day average of around 2640 transactions, with a high of 3570 and a low of 2190. Diving deeper into the network, based on a 30-day average, there is a gap of 47 seconds between each transaction, with a high of 56 seconds and a low of 38 seconds. Each of these transactions, based on a 7-day average, is worth $40,687.66, with a high of $55,243.40 and a low of $23,476.85. In comparison to SAND, MANA has slightly less valuable network activity. Not only are there less transactions happening over the network, but they are also of a smaller monetary value. A good reason for this could be Decentraland’s lack of impactful experiences. Although the platform is publicly accessible, the platform itself is virtually empty, with little to no hype around the usage of the space to develop meaningful, user-driven experiences. It is also important to note that there are only around 1000 daily active users.
Final Comparisons and Conclusion
Sandbox is admittedly the more established entrant into the metaverse. The network transfers more value, and it has a more established system of users. However, the MANA token has more robust tokenomics that could nudge market sentiments. On the other hand, it is important to note that all the value being transferred through the Sandbox network is much more significant, considering that the game is yet to be released to the general user. It’s vesting schedule and tokenomics are still robust, with the only issue being whale concentration. The roadmap of the Sandbox also has events lined up in 2022 that will likely increase activity on the network, such as more public LAND sales, concerts, and progressive opening of the Sandbox to users. This leads me to believe that in comparison to the MANA token, the SAND token has a higher potential in the price discovery phase, which implies greater multiples on investment. However, these asymmetric returns come at the cost of betting on a project that is in an earlier stage than Decentraland. If we were to liken metaverse projects to video games, Sandbox takes the cake due to better user engagement, far more hype, and clear promise for implementing the demands and interests of the end user. The Decentraland experience is yet to grow into its own platform, and with a rapidly evolving market, this could prove to be a crutch.